
Last updated: November 5, 2026 · By Sanket Goyal
A high debt to GDP ratio means a country owes a lot compared with what its economy produces in a year. It is not a bill due tomorrow. It is a measure of how heavy the debt is relative to the country’s ability to pay it back, and the heavier it gets, the less room a government has to react when trouble hits.
The ratio is in the news because US federal debt has now grown to roughly the size of the whole economy. I want to explain what the number says, what it does not say, and why it matters to someone in Delhi or Dallas who never looks at a budget.
What the debt-to-GDP ratio actually measures
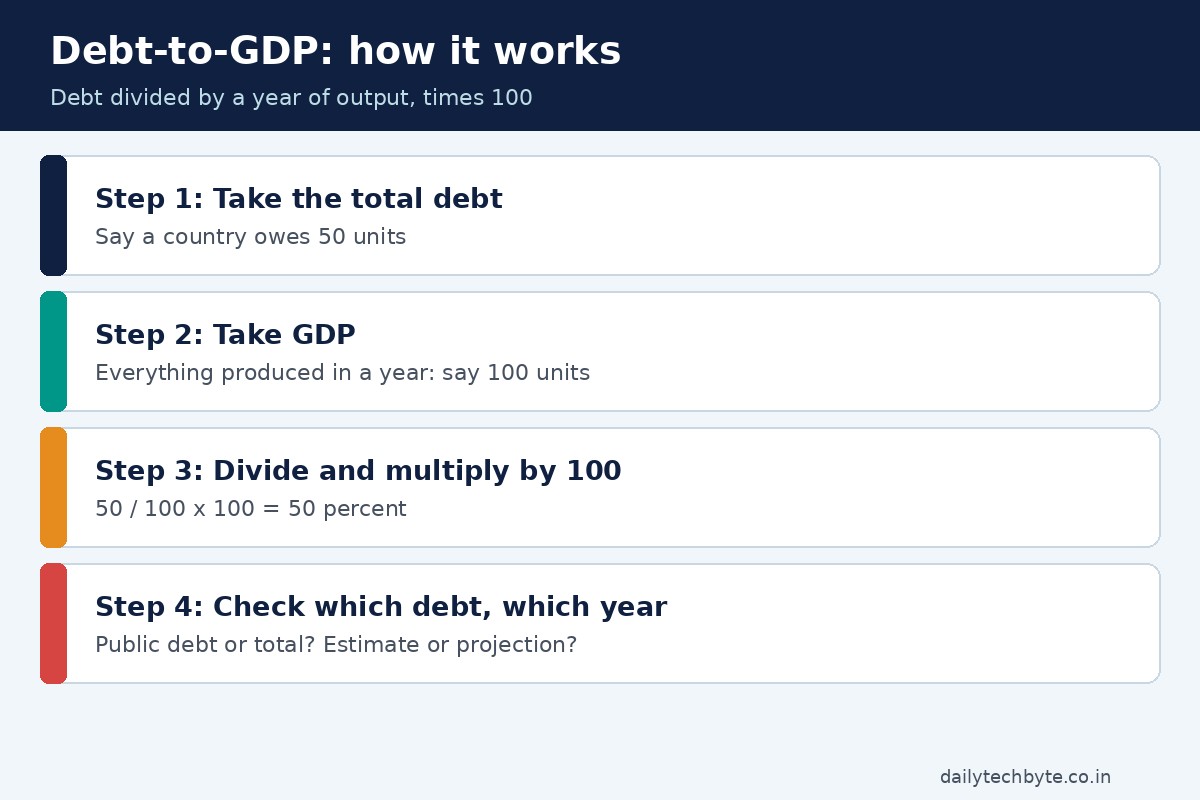
Take the total debt, divide it by GDP (the value of everything a country produces in a year), and multiply by 100. The result is a percentage.
Why not just look at the debt number? Because a big number means little on its own. Think of two households. One owes 20 lakh rupees and earns 40 lakh a year. Another owes 20 lakh and earns 4 lakh. Same debt, very different stress. The US Treasury makes the same point: comparing debt to GDP shows the burden relative to total economic output, which makes it a better gauge of a country’s fiscal situation than the raw debt figure.
Which debt is counted?
This trips people up. For the United States, the Treasury splits the national debt into two parts: debt held by the public (owed to outside lenders such as banks, investors and other countries) and intragovernmental holdings (money one part of the government owes another). Headlines sometimes quote one, sometimes the other, so two articles can give different ratios without either being wrong. The national debt also leaves out state and local government debt, and anything households owe, like home loans or credit cards.
Always check which debt and which year a ratio refers to before comparing two numbers.
Where the US and India stand
Here is what official sources say. I am using projections where they are projections, and I am saying so.
| Item | US | India (central government) |
|---|---|---|
| Latest official figure | Debt held by the public about 101% of GDP in 2026 (CBO projection, Feb 2026) | 55.6% of GDP, budget estimate for 2026-27 |
| Recent path | Crossed 100% of GDP in 2013 | Peaked at 62.6% in 2020-21, then declined |
| Official direction | Projected 120% by 2036 | Target 50% (give or take 1 point) by 2030-31 |
A few things to read carefully. The US figure counts debt held by the public. India’s figure is for the central (Union) government only, so it leaves out state debts. And the 2036 US number is a projection that depends on future laws and the economy, not a prediction set in stone.
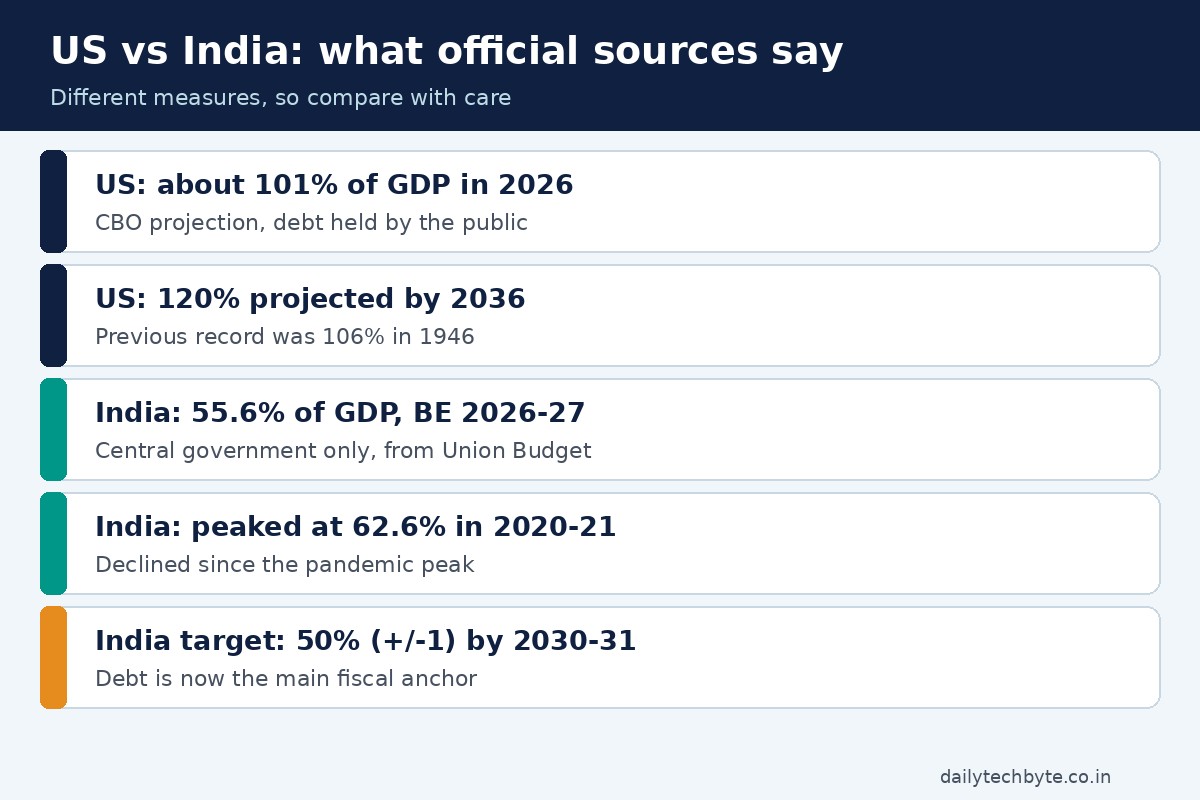
The US Congressional Budget Office also noted that the previous record for debt held by the public was 106% of GDP, reached in 1946 just after World War II. Its projections show the ratio passing that record by 2030 and continuing to climb. India’s government, by contrast, has set a glide path to bring its ratio down over the next few years. Whether it gets there depends on how fast the economy grows in money terms and how much it borrows each year.
Why a high ratio matters
A high ratio is not a crisis by itself. Countries have lived with big debts for a long time. The problem is what it does to choices.
- More of each rupee or dollar goes to interest. India’s finance ministry itself said a declining ratio gradually frees up resources for priority spending by reducing the outgo on interest. Flip that around: a rising ratio means more money tied up paying interest, and less for roads, schools and hospitals.
- Less cushion in emergencies. In 2020 the pandemic pushed India’s central debt ratio to its peak of 62.6%. Governments with high debt before a shock have less room to spend through it.
- Pressure on borrowing costs. Lenders watch the ratio. If they worry, they ask for higher interest, which makes the debt costlier to carry. That feeds into loan rates for ordinary people over time.
- Tough trade-offs. Eventually a government has to raise taxes, cut spending, grow faster, or some mix. None of these is popular.
I will be honest: economists argue about how high is too high. There is no magic line where trouble starts, and I would be wary of anyone who claims one.
How a country brings the ratio down
Notice that the ratio has two parts, so it can fall in two ways.
- Shrink the top: borrow less each year, meaning a smaller deficit. India’s budget sets a fiscal deficit of 4.3% of GDP for 2026-27 as part of its plan.
- Grow the bottom: if the economy grows faster than the debt, the ratio drops even without paying anything off.
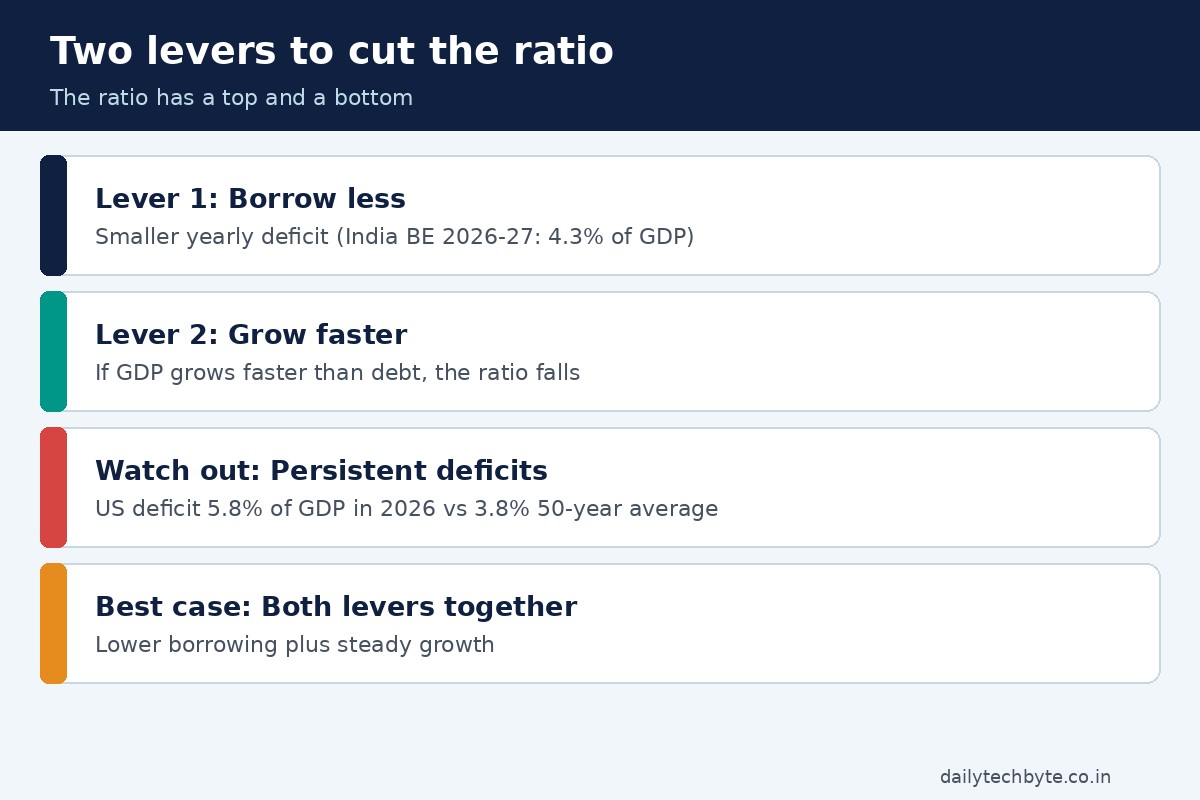
For comparison, the CBO says the US deficit is 5.8% of GDP in 2026, against an average of 3.8% over the last 50 years. Deficits that stay above the pace of growth push the ratio up year after year.
What it means for you
You do not need to track the ratio daily. But it helps to know how it can reach your life.
- Loan rates. Government borrowing costs influence what banks charge on home and car loans. If you plan a big loan, watch the direction of rates.
- Savings and investing. Government bonds are a common safe place for savings. Their yields move with how lenders see a country’s finances.
- Taxes and services. Over the long run, large debts can mean either higher taxes or slower growth in public spending.
- Exams and studies. If you are studying economics or preparing for a civil services exam, this ratio is a basic concept worth knowing cold.
Check the budget documents of your own government now and then. Most publish a short summary, and the debt line is usually easy to find. For other money topics, see how to withdraw money from PostPe without charges and our guide to Paytm Payments Bank alternatives.
Common mistakes when reading the ratio
- Comparing a central-government ratio with a general-government one. They cover different things.
- Mixing debt held by the public with total debt.
- Treating a projection as a fact.
- Assuming a high ratio means a country is about to default. Many high-debt countries borrow in their own currency and manage for years.
- Ignoring GDP revisions. When a country updates how it measures GDP, the ratio can shift without any new borrowing.
The bottom line
A high debt-to-GDP ratio means the debt is large relative to the economy, which reduces flexibility and raises the cost of borrowing over time. It is a warning light, not a countdown. Read it with its context: which debt, which year, estimate or projection. Then you can follow budget news without getting spooked by one big number.
FAQ
What does a high debt-to-GDP ratio mean?
It means a country’s debt is large compared with its yearly economic output. It signals less room to borrow or spend in a crisis and more money going to interest.
Is a debt-to-GDP ratio above 100% bad?
Not automatically. It means debt is bigger than a year of output. The risk depends on interest rates, growth and who holds the debt, so it needs context.
How is debt-to-GDP calculated?
Divide total government debt by GDP and multiply by 100. For example, debt of 50 on GDP of 100 gives a ratio of 50%.
What is India’s debt-to-GDP target?
India’s Union Budget 2026-27 targets a central government ratio of 50% give or take 1 point by 2030-31, from an estimated 55.6% in 2026-27.
How can a country lower its debt-to-GDP ratio?
By borrowing less each year, by growing the economy faster than the debt grows, or both.